


A metric used to gauge the skill of active managers has fallen to its lowest level in at least 16 years after markets were sent into a tailspin by rising inflation and interest rates this year, Trustnet research has found. 
The information ratio measures the risk-adjusted returns on a portfolio against a relevant benchmark, considering its excess return and volatility relative to the index. It is often seen as a way to differentiate between the skill of active managers and blind luck.
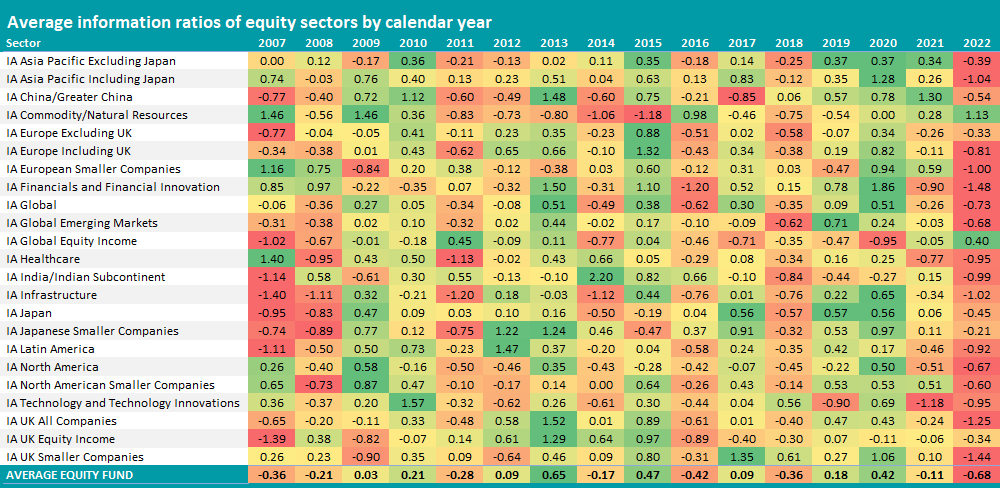
In this research, Trustnet examined the information ratios of funds in 23 equity sectors in the Investment Association universe for each year since 2007 and over 2022 so far, relative to the most common benchmark of each peer group. We also included funds that have closed over this time frame, to eliminate survivorship bias.
In general, an information ratio of between 0.40 and 0.60 range is considered good, while a score of 1 or above would be very good. But the average active equity fund we looked at in this study has an information ratio of -0.68 for 2022 to date.
Source: FinXL
This is the worst result in all of the years considered in this research by some margin – the second lowest information ratio of the past 16 years was the -0.42 recorded in 2016, when the Brexit referendum and the election of Donald Trump as US president threw active investors a curveball.
Among the equity sectors where 2022 is causing the worst information ratios for the past 16 years are IA Global, IA UK All Companies, IA UK Smaller Companies, IA North America, IA Asia Pacific Excluding Japan and IA Global Emerging Markets.
There are negative information ratios in 21 of the 23 equity fund sectors assessed in this research. This is the worst result over the period under consideration; 2016 and 2018 are in joint second, when 18 sectors had negative information ratios.
The worst average information ratios are found in the IA Financials and Financial Innovation (-1.48), IA UK Smaller Companies (-1.44), IA UK All Companies (-1.25), IA Asia Pacific Including Japan (-1.04) and IA Infrastructure (-1.02) peer groups.
The only exceptions are IA Commodity/Natural Resources and IA Global Equity Income with average positive information ratios of 1.13 and 0.40, respectively.
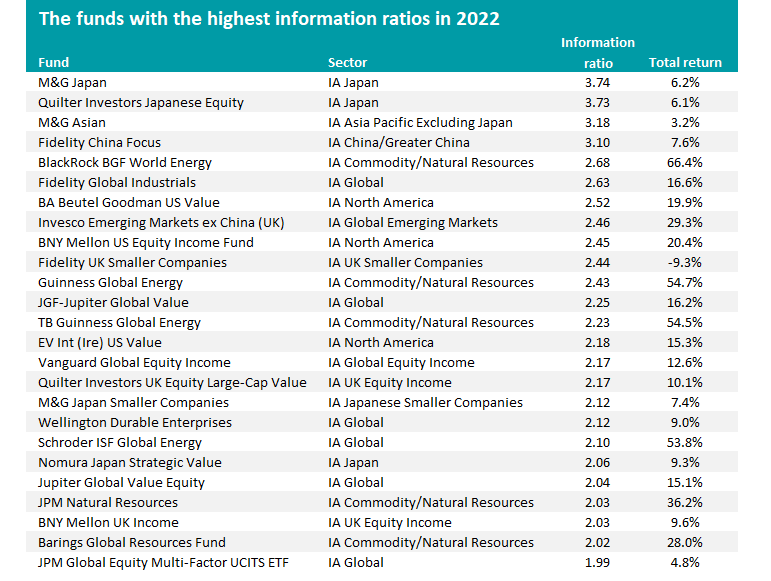
In all, just 389 equity funds out of 1,556 we looked at – or 25% of the sample – have a positive information ratio for the first 11 months of 2022. Those with the highest can be seen in the table below along with their total return over the same period.
Source: FinXL
All of the funds on the list have made positive returns in 2022 bar one – an impressive feat given that 83% of funds in the Investment Association universe have posted losses over the same period.
Fidelity UK Smaller Companies is the one fund in the table that is down this year, but it operates in one of the hardest hit parts of the market. Its 9.3% loss ranks it seventh out of the 203-strong IA UK Smaller Companies sector, where the average fund is down close to 25%.
M&G Japan takes the top spot with an information ratio of 3.74; its 6.2% return this year compares with a 6.7% loss from its average peer. There are another three Japanese equity funds in the above table and another three that focus on Asian or emerging market equities.
But the dominant theme is value investing. Many of the funds in the table (aside from those focusing on commodities) invest in value stocks, which after a significant period of time in the wilderness have started to outperform in 2022.
M&G Japan is one of these value funds but others on the list include BNY Mellon US Equity Income, Fidelity UK Smaller Companies, Vanguard Global Equity Income and Jupiter Global Value Equity.