


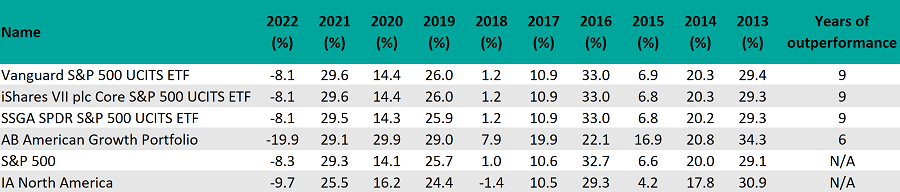
The list of most consistent IA North America funds of the past decade is dominated by ETFs, with three – Vanguard S&P 500 UCITS ETF, iShares VII plc Core S&P 500 UCITS ETF and SSGA SPDR S&P 500 UCITS ETF – beating the most popular benchmark in the sector, the S&P 500, in nine of the past 10 years.
Another passive fund, HSBC S&P 500 UCITS ETF, beat the index in eight of the past 10 years.
The best four active funds were AB American Growth Portfolio, Jupiter Merian North American Equity, Alger The American Asset Growth and GS US Focused Growth Equity Portfolio, which beat the index in six of the past 10 calendar years. The first of these did the best against its peer group composite, beating the sector average in eight of the past 10 calendar years.
Performance of funds vs sector and index
Source: FE Analytics
While exchange-traded funds (ETFs) should in theory only replicate the performance of the underlying index – and even underperform once fees are taken into account – many of them use stock lending to help boost performance.
“This is a common process in long-term investing, where a select third party borrows a limited amount of the passive fund’s holdings in exchange for a fee,” explained the analysts at FE Investments, which include the Vanguard S&P 500 UCITS ETF on their Approved List.
“As a security measure the borrower will place a collateral deposit with an independent intermediary, which is generally of similar or higher quality.
“Although Vanguard operates stock lending, it typically won’t lend more than 3% of the portfolio, therefore the performance impact is minimal.”
The slight outperformance each year meant all three ETFs beat the S&P 500 by about 8 percentage points over the decade in question and the IA North America sector by well over 50 percentage points.
SSGA SPDR S&P 500 UCITS ETF, which had slightly higher ongoing charges figures (OCFs) than the other two ETFs at 0.09%, did the worst, with gains of 324.2% compared with 316.4% from the S&P 500. Vanguard S&P 500 UCITS ETF and iShares VII plc Core S&P 500 UCITS ETF both have an OCF of 0.07%. They made 326% and 325.6% respectively.
Performance of funds vs sector and index over 10yrs
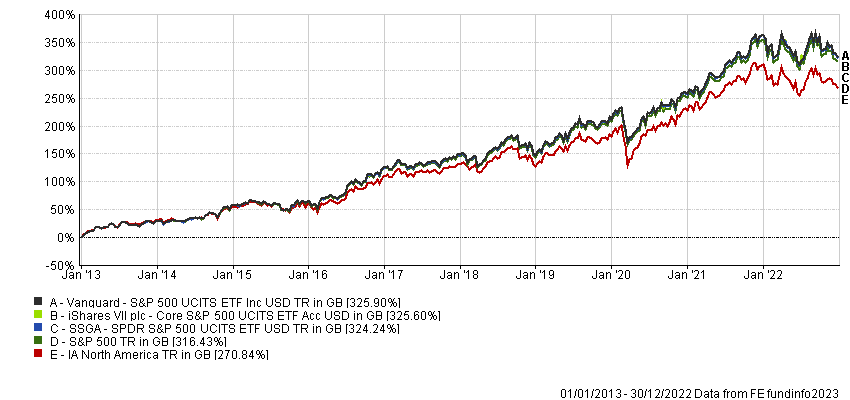
Source: FE Analytics
While passive funds have been the place to be over the past decade, Hawksmoor Investment Management market commentator Jim Wood-Smith warned that the change in macroeconomic conditions has left them vulnerable.
He pointed out that indices are biased in favour of the largest businesses, with size determined by the value of the equity of the company, rather than by sales, profits or dividends.
“What this means is that the more popular, or more overvalued a company and its share price become, the greater the weighting in the index,” he said.
“And the more they weigh, the more ‘passive’ investors have to buy. It is a self-fulfilling process of buying the most popular (and probably overvalued) at the expense of the least popular and probably cheapest,” he explained.
-
On the active side, AB American Growth Portfolio invests in companies that offer compelling growth potential and the ability to persistently earn returns that exceed their cost of capital. In particular, it looks for businesses with sustainable competitive advantages, transparent business models, attractive economic returns and strong cash generation.
In their most recent note to investors, managers Frank Caruso, John H Fogarty and Vinay Thapar issued a note of caution after markets rallied on hopes that the Federal Reserve’s rate-hiking cycle may be nearing its peak.
They said that whether the strong performance of the S&P 500 so far this year represents a short-lived bounce or the start of a sustained reversal lies in earnings figures.
“While still early in the fourth-quarter earnings performance discovery process, results thus far have generated little clarity around what is yet to come,” the managers explained. “We expect this question to remain open for at least another quarter or two. Given the oddities of the current cycle, developing informed views on the profit prospects for individual companies rather than the entire market looks like a sounder approach than ever before.”
Performance of fund vs sector and index over 10yrs
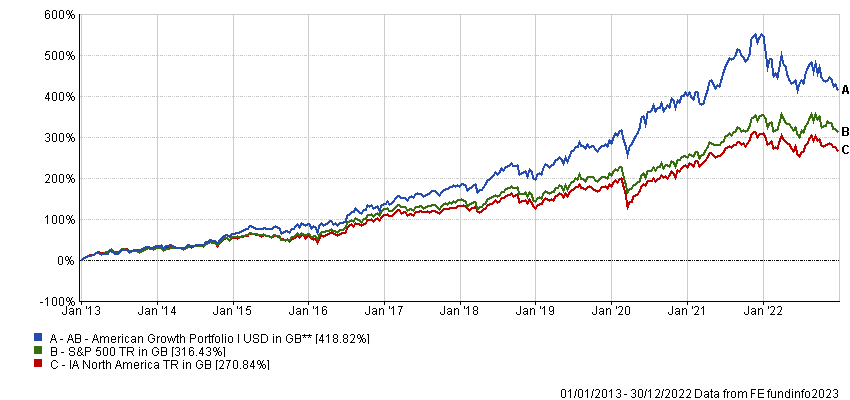
Source: FE Analytics
AB American Growth Portfolio made 418.8% over the 10-year period in question. The $6.4bn fund has ongoing charges of 0.95%.