


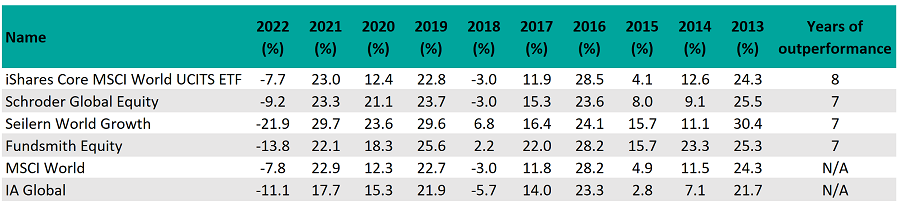
A tracker, iShares Core MSCI World UCITS ETF, is technically the most consistent IA Global fund of the past decade, beating the MSCI World index – the most common benchmark in the sector – in eight of the past 10 calendar years, more than any of its peers. It also beat its peer group composite in the same number of years.
Of the 236 funds with a track record long enough to be included in the study, another three funds – Schroder Global Equity, Seilern World Growth and Fundsmith Equity – beat the MSCI World index in seven of the past 10 years and their peer group composite in at least nine.
Performance of funds vs sector and index
Source: FE Analytics
As a tracker fund, the $48bn iShares Core MSCI World UCITS ETF would not be expected to beat the index it aims to track – after fees it should, in theory, underperform.
However, it uses a process called sampling to replicate the performance of the underlying index. This involves holding a representative basket of securities that will closely mirror the full index’s performance.
The analysts at FE Investments said the main risk with this strategy is in the strength of the computerised model or sampling process being used by the manager.
“In extreme market conditions, being underweight or overweight select stocks from the index, if not rectified quickly, can rapidly lead to performance diverging from the index,” they said.
To supplement fund returns and compensate for the trading costs involved with direct ownership of the securities, iShares engages in stock lending. This involves a third party borrowing a limited amount of the passive fund’s holdings in exchange for a fee. When reinvested, profits from stock lending reduce the effect of management fees, further minimising overall tracking difference to the index.
The analysts at FE Investments said stock lending also marginally increases the fund’s risk profile.
“However, borrowers are first vetted for worthiness, and must place security deposits equal to or above the value borrowed with independent intermediaries,” they added.
iShares Core MSCI World UCITS ETF made 218.3% over the 10-year period in question, compared with 215.6% from its benchmark and 161.1% from its sector.
Performance of fund vs sector and index over 10yrs
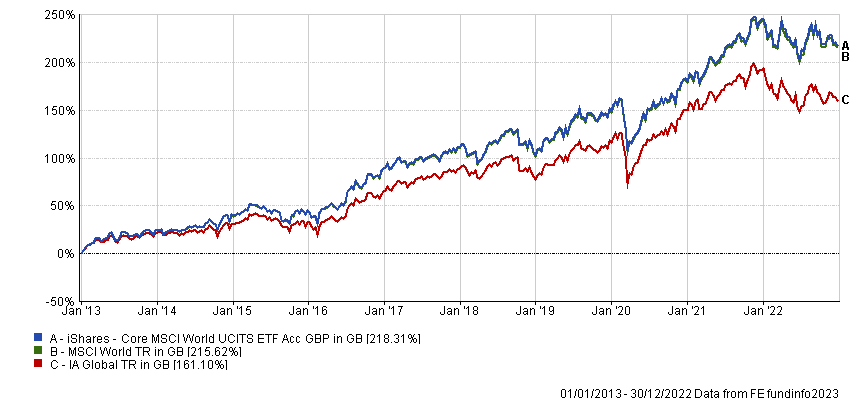
Source: FE Analytics
While the tracker beat the MSCI World index in the highest number of calendar years over the past decade, Schroder Global Equity beat the sector average most often, with a perfect 10 out of 10.
Schroder Global Equity is headed up by Alex Tedder, who searches for what he calls the “growth gap”. This arises from differences between company fundamentals and valuations, caused by three persistent market inefficiencies: an over-reaction to short-term newsflow; an over-reliance on a company’s historic growth and the failure to identify catalysts that can change its direction; and a failure to look far enough ahead when appraising companies’ earnings power.
Schroder Global Equity made 242.9% over the 10-year period in question. The £1.2bn fund has ongoing charges of 0.52%. However, it has limited availability on most major platforms.
Seilern World Growth beat the sector average in nine of the past 10 years. Managers Michael Faherty and Marco Lo Blanco invest in high-quality companies with proven track records, sound financials and predictability of future earnings growth.
“These businesses typically have superior business models, stable and predictable business economics, a sustainable competitive advantage and high returns on capital,” they said.
“They are run by management teams that exhibit integrity and whose interests are closely aligned with long-term shareholders.”
Seilern World Growth made 319.1% over the 10-year period in question. The £1.7bn fund has ongoing charges of 1.05%.
Performance of funds vs sector and index over 10yrs
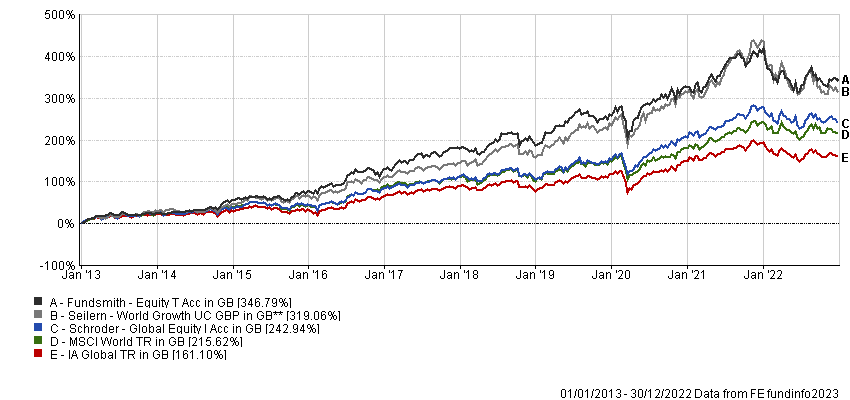
Source: FE Analytics
Last up is Fundsmith Equity, which also beat the sector average in nine of the past 10 calendar years. Manager Terry Smith summed up his strategy as: “Buy good companies. Don’t overpay. Do nothing.”
“Good companies” are those with strong margins and cashflows, where growth is organic and does not depend on external factors.
“Ideally these companies will derive their profit from many everyday, small-ticket, repeatable and predictable transactions,” explained the analysts at FE Investments. “This typically leads the fund to consumer staples, technology and healthcare sectors.”
Square Mile Investment Consulting & Research said that while this fund has many qualities, it has seen a significant rise in assets under management in recent years, which can be a natural headwind for any strategy.
“While we do not yet see this as an impediment to the investment process, especially given the low levels of turnover involved, it is something to remain conscious of when reviewing this proposition,” the group said.
Fundsmith Equity made 346.8% over the 10-year period in question, the highest amount of any fund on the list. The £23.8bn fund has ongoing charges of 1.04%.