


Inflation and the cost-of-living crisis have been weighing on people's shoulders and a reason why investors have been prioritising dividend payments over companies that can grow their earnings lately.
However, it hasn't been easy to receive good and stable levels of income from UK investments, as sterling depreciated and the dollar strengthened, making it more profitable to own foreign investments.
As both the volatility of the pound and uncertainty for the economy’s future could continue into the medium term, investors might be better off seeking income abroad, and a natural home could be the IA Global Equity Income.
However, stuffing a portfolio full of these funds may not be prudent as some in the sector are more correlated than others.
The study of correlation aids investors building up their portfolios by highlighting how frequently two funds have moved up or down simultaneously – an important measure to consider when thinking about differentiation.
If two funds are highly correlated to each other, they are subject to the same market forces, and it might be wise not to hold them in the same portfolio of investments, in order to avoid doubling one’s exposure to the same downward risks.
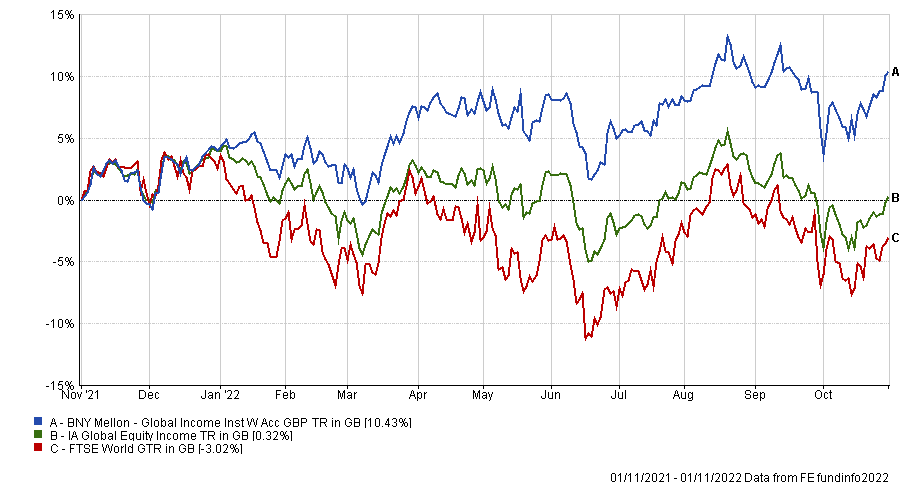
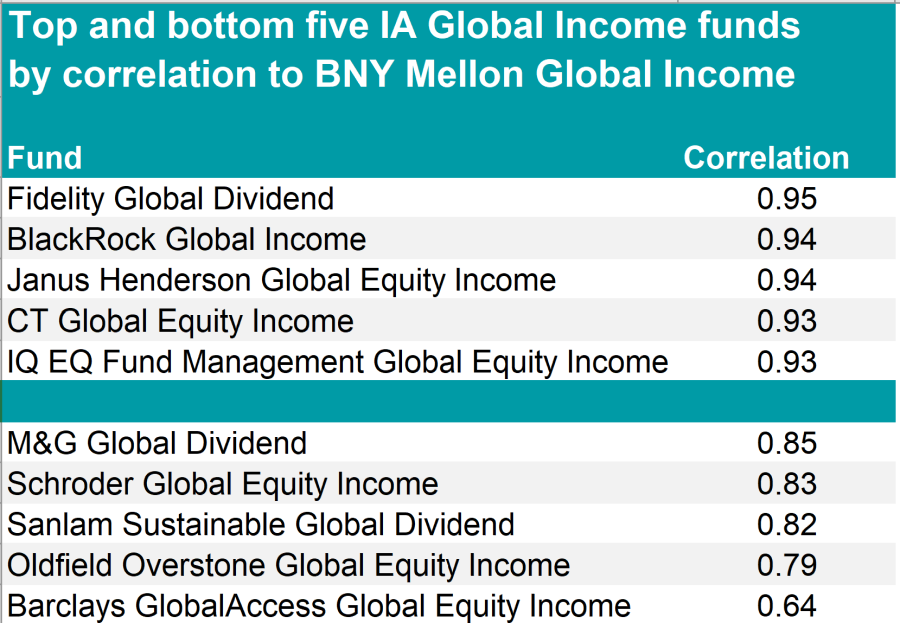
Below, Trustnet analyses the 10-year correlation of BNY Mellon Global Income – the largest IA Global Income fund with a portfolio worth £3.3bn – to its sector peers.
Co-led by Jon Bell and Robert Hay, the managers aim to achieve long-term growth through the compounding of dividends over time and invest in stocks that yield at least 25% more than the FTSE World Index.
Their bottom-up process, which also takes thematic considerations into account, allows them to invest in quality companies with a dominant market position, sensible balance sheet and ability to generate cash for sustainable yields, Kate Marshall, lead investment analyst at Hargreaves Lansdown, explained.
“Developed markets are a key focus with around 40% of the fund invested across North America and Europe. They also invest in higher-risk emerging markets but exposure here is mainly through the revenues of countries listed elsewhere.”
Despite not appearing in Hargreaves Lansdown’s Wealth Shortlist, the fund remains popular and has never fallen below the first quartile of its sector and outperformed its benchmark and index over one year by 10 and 12 percentage points, respectively.
As more investors are looking for income opportunities outside the UK, they should be aware of what funds to avoid if they already own BNY Mellon, however, as despite its wide remit, the pool of quality dividend-paying companies is shallower than some might expect.
As a result, some funds can be extremely correlated to each other. Looking at BNY Global Income, the most similar is Fidelity Global Dividend, which has a 95% correlation to BNY Global Income.
Eight more funds, however, also highlighted 90% correlation or higher, including portfolios from Blackrock, Janus Henderson and Columbia Threadneedle.
The vast majority of remaining funds had a correlation of 80% or higher, including defensive strategies, such as IQ EQ Fund Management Defensive Equity Income (88%), and sustainable strategies, such as Sanlam Sustainable Global Dividend (82%).
In this bracket, there were two funds that have a combined focus on both income and growth – TB Saracen Global Income & Growth and Baillie Gifford Global Income Growth.
Source: FE Analytics
With a respective correlation of 79% and 64%, Oldfield Overstone Global Equity Income and Barclays GlobalAccess Global Equity Income are the two most-diversified options to BNY Mellon Global Income.
While the BNY fund is more focused on quality, with financials, healthcare and consumer staples among its top sector weightings, the Oldfield fund is a true contrarian portfolio of ‘value’ stocks. Perhaps the main difference between the two is the countries they invest in.
While BNY Mellon Global Income is more than half exposed to the US, Oldfield Overstone Global Equity Income’s largest regional position is the UK at 26.7%.
Barclays GlobalAccess Global Equity Income meanwhile is a multi-manager strategy that is managed by Artemis (which has a target allocation of 25% of the portfolio), Kleinwort Benson Investors Group (45%) and Baillie Gifford (30%), making it very different to those above.