


Investing in growth was the way to make money for much of the decade after the financial crisis and was turbocharged by Covid-inspired lockdowns in 2020, but the investment style has hit the skids in recent years as higher inflation and interest rates have caused value investments to soar.
This revival, however, will be short-lived and growth should be back on investors’ radar according to Gerrit Smit, FE fundinfo Alpha Manager of the Stonehage Fleming Global Best Ideas Equity fund, who said that “investors will soon long for growth again, and with valuation multiples now down to long-term average levels, they may be willing to pay for it.”
“Value outperforming growth by almost a third last year was the most remarkable story of an otherwise dismal period for equities. It was so noteworthy because, on a long-term compound performance measure, growth has beaten value by 4% per annum. But today, the conditions under which value can continue to outperform have simply run their course.”
Below, Smit looks at three key indicators (treasury yields, manufacturing new orders and valuation ratios) to claim that “the stars are realigning for growth”.
Not all agree, however with Ian Lance, co-fund manager of Temple Bar Investment trust, opposing this view.
Starting with the arguments for growth, the first metric Smit considered was the dynamic between the S&P Value/Growth Index against economic growth, which he used treasury yields and the copper/gold ratio as a proxy for.
S&P Value/Growth Index vs treasury yield (%) and copper/gold ratio
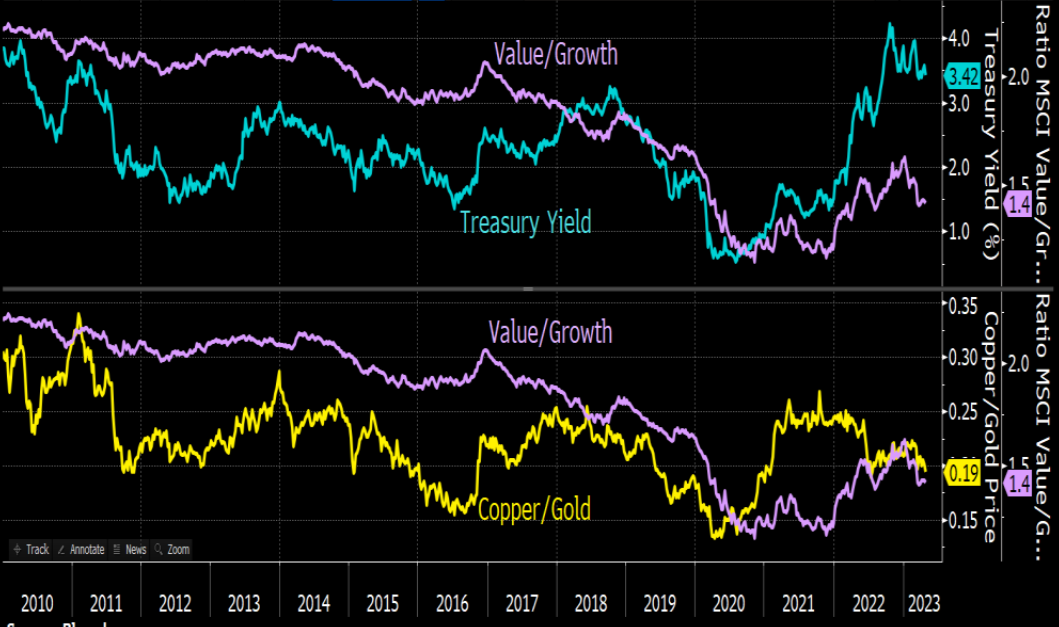
Source: Stonehage Fleming
The top section of the above chart shows that the treasury yield has dropped from more than 4.2% to 3.4% (the blue line), with the Value/Growth Index (purple line) following suit. The US growth outlook seems “moderate at best, with little reason for rates moving much higher”, which will rekindle appetite for growth, said Smit.
“Those wondering if economic growth will come to the rescue of value investors are likely to be disappointed. The copper/gold ratio has been falling recently, indicating that the economy is not going to bail investors out. That also argues for growth at the expense of value,” he concluded.
The second indicator was the level of new orders. The Manufacturing New Orders Index has dropped sharply from the beginning of 2021 and has now been in contraction territory for almost a year. The Growth/Value Index has come down with it, as the chart below shows.
PMI New Orders Index vs S&P Growth/Value Index
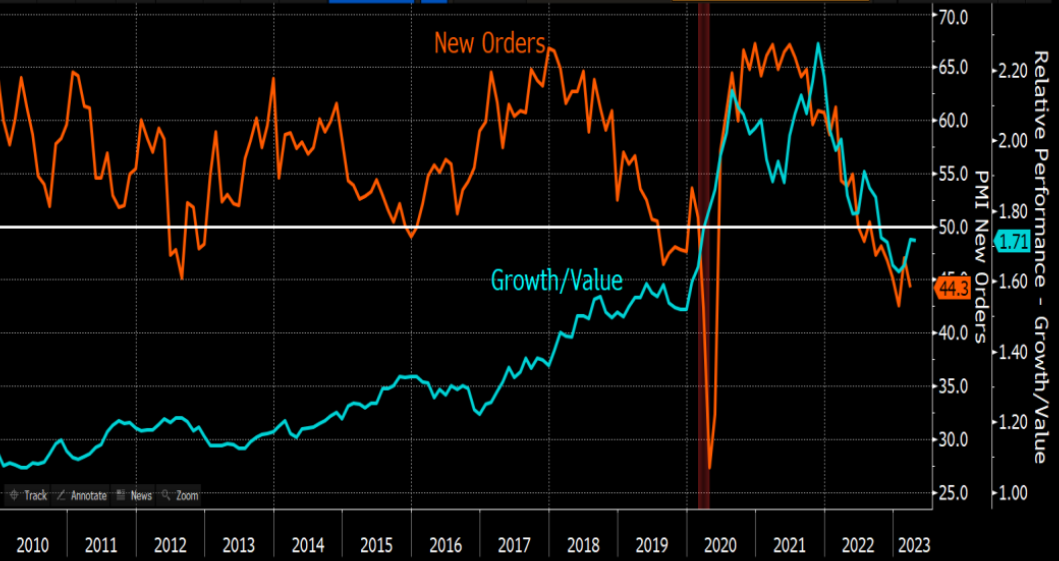
Source: Stonehage Fleming
“With supply chain complications now mostly resolved, the Orders Index is unlikely to stay in contraction territory for long. On this basis, investors may be considering switching to growth,” said the manager.
Smit’s last piece of data concerned forward price-to-earnings (P/E) valuation ratios.
“Growth is, of course, usually valued higher than value. The relative valuation ratio (the orange line in the chart below) is, however, currently below its long-term average,” he said.
“Especially with a fairly dull economic and earnings growth outlook, this relative valuation level is now more attractive than it has been since 2017. There are already signs of growth’s comeback.”
Forward P/E valuation ratios – S&P Value vs Growth
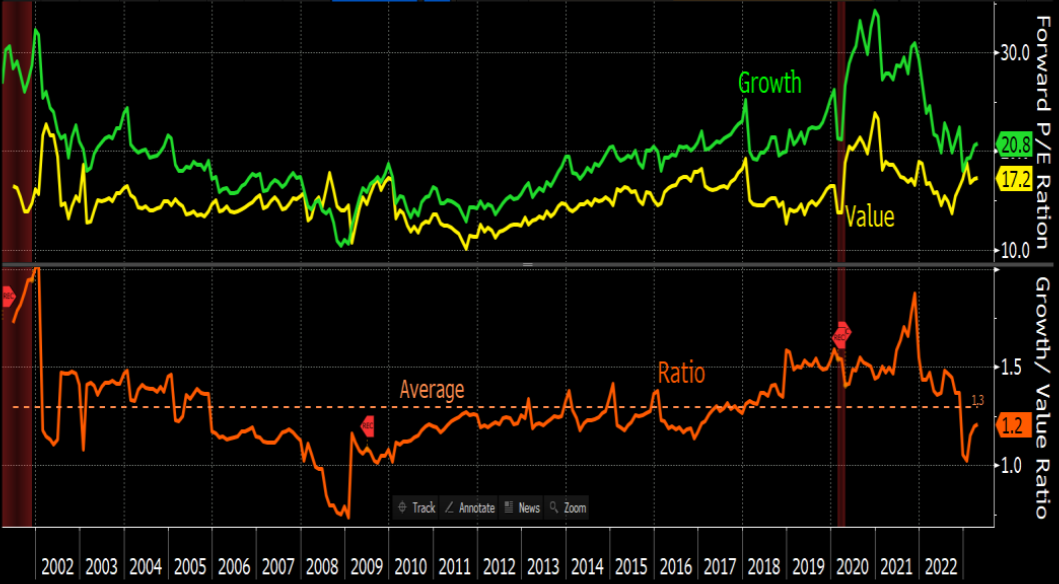
Source: Stonehage Fleming
But Lance was not convinced that now is the time to start adding to growth.
“Empirical data from Eugene Fama and Kenneth French [who developed the Fama and French Three Factor Model] identify three factors that produce excess returns in the long run – value, momentum and size, whereas growth as a factor produces returns below that of the market,” he said.
“It also shows that growth has only beaten value in two of the past 11 decades, which were the 1920s and the 2010s. Recency bias has led many to believe that growth as a factor works but this period was very much the exception. Beware of pro-growth charts starting in 2010.”
Lance’s second point related back to Cliff Asness’s and Rob Arnott’s research, which has shown that most of the excess return to growth in the 2010s was due to growth stocks becoming more expensive, which “is not a sustainable source of returns,” he said.
But, if investors are still looking to buy growth, the manager recommended “at least to do so when it’s cheap”.
Today, the spread in valuation between value and growth stocks is “at one of the widest points for 50 years”. Value stocks today are cheaper than they were in 2000, he argued.
“As the Nasdaq bubble popped in 2000, eventually going on to lose 75% of its value, there was one rally of 45% and another of 40%. In hindsight, both of these were excellent chances to sell over-valued technology, media and telecom stocks rather than a return of growth investing.
“Conversely, 2000 was the start of a five-year period of strong returns from value investing,” he concluded.